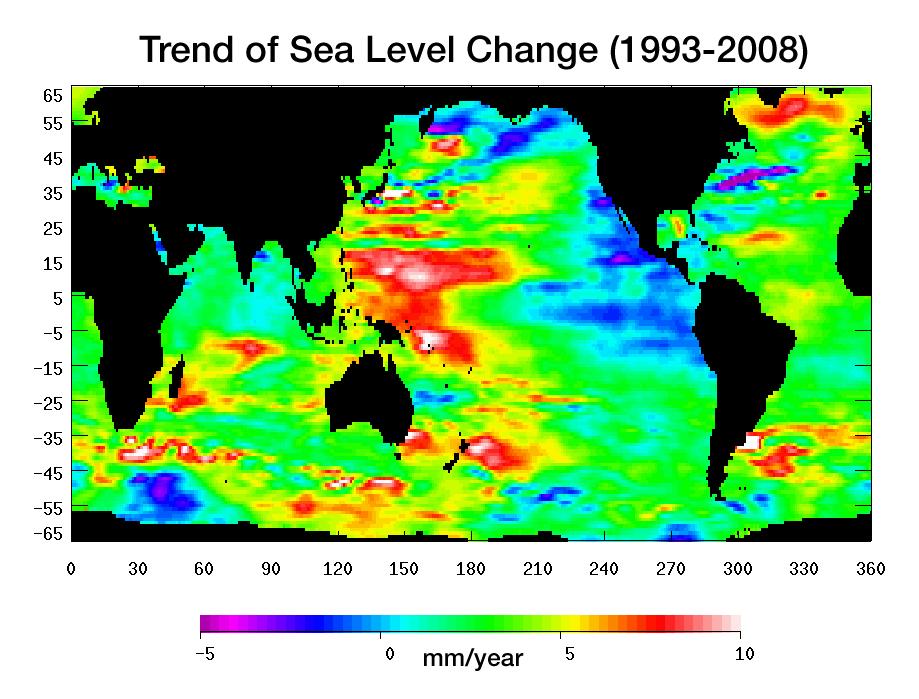
The week's Map Monday shows sea level changes 1993-2008. The data is based on two NASA/CNES satellites (Topex/Poseidon, Jason-1). White, red, and yellow areas show locations of increased sea level, while purple and blue show decreased sea level. The most obvious change is located in the western Pacific Ocean, reflecting the negative phase of the Pacific decadal oscillation (PDO). The PDO is similar to ENSO, except it can last for decades. It is also associated with weather events similar to ENSO, except not as extreme. During the negative phase of the PDO, the western Pacific is warmer, while the eastern Pacific cools (like La NiƱa).
Map Information
PIA11002: Portrait of a Warming Ocean and Rising Sea Levels: Trend of Sea Level Change 1993-2008. 2008. NASA/JPL.
Posted by Chris M Monday, February 2, 2009
Google Earth Historical Imagery
A couple week ago, BrianR at Clastic Detritus showed off the new higher-resolution bathymetry coverage in google earth. Well, version 5.0 was released today and it has some other fun stuff to play with. I like the historic imagery.
The pain about historic imagery is finding it and getting in a usable format on your computer. Even if you not going from a paper image, it still requires some work. Well google has gathered up some old imagery. Older than 20 years is pretty spotty, but there are some locations worth checking out.
The below images are of southern Lake Tahoe from 1940, 1969, 1987, 2004, and 2007. The resolutions are low, so I suggest opening the location up in google earth (38°56'14.56"N, 120° 0'38.81"W, 4.4 km altitude).
In 1940, notice the large marshland in the middle and the elongated delta of a stream in the NE.
Now in 1969, the marshland is a marina and the delta is reduced in size on the NW (sediment no longer allowed to replace erosion of delta?). Even the stream feeding the delta has been channelized.
In 1987, a spit has developed on the NE side of the stream's mouth.
It is 2004 and there is a new delta. Why is it forming now? Perhaps there is an increased sediment supply from the stream or dredging is no longer occurring?
Finally, we are at the newest image in 2007. The delta is gone again!
Posted by Chris M
Map Monday #10: Darwin's South America Cross Sections
With February being the bicentennial of Darwin's birth and the 150th anniversary of On the Origin of Species, how about a map by Darwin. The above map shows three cross sections of the southern Andes. Included are not only elevations but simple bedrock types (granite, sandstone, etc...).
Map Information
Darwin, C. R. 1846. Plate 1. From Geological observations on South America. Being the third part of the geology of the voyage of the Beagle, under the command of Capt. Fitzroy, R.N. during the years 1832 to 1836. Smith Elder and Co.
Map from The Complete Work of Charles Darwin Online
Subscribe to:
Posts (Atom)