Posted by Chris M Monday, May 24, 2010
Map Monday 19: Bathymetry of Lake Baikal
Lake Baikal is most famous for being the deepest and most voluminous lake in the world [assuming you don't count the Caspian Sea]. For me, the most striking feature isn't the deepest point, but rather, the average depth at 744 meter. The bathymetry, instead sloping to the lowest point, it has steep sides and a flat bottom. Image a fjord, although it isn't glacial in origin, rather tectonic. This oblique DEM gives another perspective.
Map Information
The INTAS Project 99-1669 Team. 2002. A new bathymetric map of Lake Baikal. Open-File Report on CD-Rom
Posted by Chris M Monday, May 17, 2010
Map Monday 18: 1911 Mount St Helens
Map Information
U.S. Geological Survey. 1919. Mount St Helens quadrangle, Washington 1:125,000. United States Department of the Interior, USGS. Hosted by University of Washington.
Posted by Chris M Monday, May 10, 2010
Map Monday 17: North Side of the Moon

Map Information
Lucchitta, B. 1978. Geologic map of the north side of the Moon. US Geological Survey. Online at the Lunar and Planetary Institute.
Posted by Chris M Monday, May 3, 2010
Map Monday 16: Vine and Matthews Magnetic Anomalies
The defining paradigm shift in 20th century earth science is clearly the widespread acceptance of plate tectonics. One of the most important lines of evidence helping to convince scientists were the existence of magnetic stripe anomalies in the rocks of the oceans. The above map, from the classic Vines & Matthews paper from 1964, shows two profiles [Atlantic and Indian Oceans]. The black is the bathymetry and the black line is the magnetic field anomalyMap Information
Figure 1 from: Vine, F.J. and D.H. Matthews. 1964. Magnetic anomalies over oceanic ridges. Nature 201:591-592.
Posted by Chris M Monday, April 26, 2010
Map Monday 15: Cosmic Microwave Background Radiation


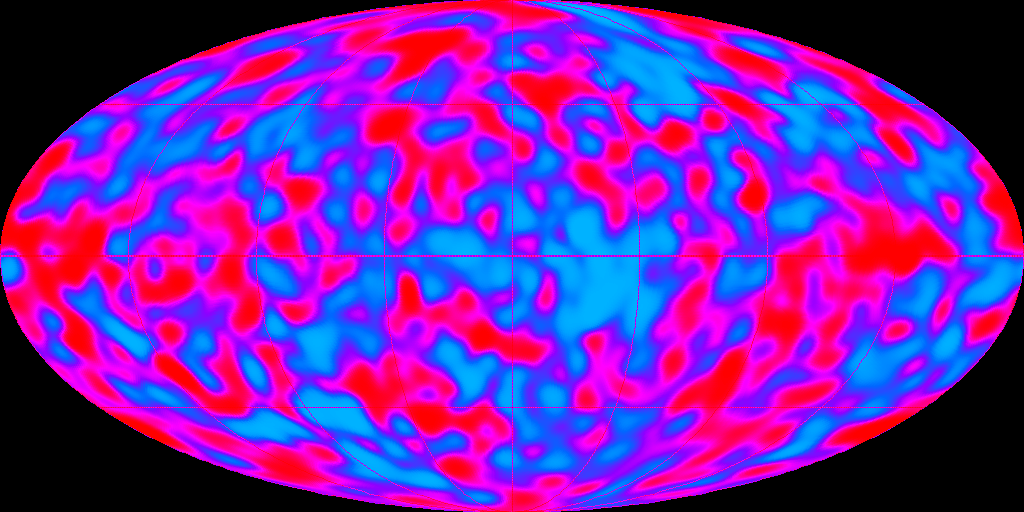
Roughly 400,000 years after the big bang, the universe had expanded and therefore cooled enough to allow hydrogen atoms to form and radiation to occur.
In 1965, Arno Penzias and Robert Woodrow Wilson of Bell Labs, found that wherever they pointed their very precise antenna they would have static. What they stumbled upon, and later won the Nobel Prize in Physics for was the experimental evidence of this relic radiation of this initial thermal radiation, now at 2.7 K.
Cosmic Background Explorer (COBE) satellite was launched in 1989 to examine the irregularities in the radiation. 2001 saw the launch of the Wilkinson Microwave Anisotropy Probe (WMAP), to provide an even more detailed look.
These images provide "maps" of the universe and its irregularities when the universe was only 400,000 years old. These irregularities explain the present day large scale variations of mass.
COBE is the top image and WMAP is the bottom image.
Map Information
NASA Goddard Space Flight Center. 1992. CMB Fluctuations from Legacy Archive for Microwave Background Data Analysis: DMR Images.
WMAP Science Team. 2010. WMAP Internal Linear Combination Map from Legacy Archive for Microwave Background Data Analysis: WMAP Data Product Images.
Posted by Chris M Monday, April 19, 2010
Map Monday 14: La Pama

In 1815, the German geologist Leopold von Bunch visited the Canary Islands and suggested that they were of volcanic origin. He also used the Spanish word caldera, meaning cauldron, to describe a few of the particular landforms he observed. The above is a later map of one of the Canary Islands, La Pama. The Caldera de Taburiente dominates the island and the map. The narrow canyon opening the Caldera to the southwest is called Barranco de Dolores [Valley of Sorrow] .
The topography of the island is beautifully shown using hachures. It wasn't until the mid 19th century that contour lines became the default way to show topography.
Map Information
Buch, Christian Leopold von. 1836. Carte Physique de Palma from Atlas des Iles Canaries.
Posted by Chris M Monday, April 20, 2009
Map Monday 13: Great Falls of the Columbia
I have been missing a few map Monday for no good reason, so maybe I can get in the grove again.
This week map is of "Great Falls of the Columbia" (aka Celilo Falls). The falls was on the Columbia River, just east of the Dallas on the border of Washington and Oregon. I use "was" because it was drowned by the construction of the Dalles Dam in 1957. The falls themselves are local knickpoints at a layer of basalt (part of the Columbia River Basalt Group).
The actual map is from the Lewis and Clark Expedition. Note the map shows their campsite and portage route around the falls.
The Map is from the David Rumsey collection.
Map Information
Allen, P., Biddle, N., Clark, W., Lewis, M. 1814. Great Falls of the Columbia. from History Of The Expedition Under The Command Of Captains Lewis And Clark, To The Sources Of The Missouri, Thence Across The Rocky Mountains And Down The River Columbia To The Pacific Ocean. Performed During The Years 1804-5-6.
Posted by Chris M Monday, March 23, 2009
Map Monday 12: Geologic Map of Surtsey

With the news of a "new island" of formed by the Hunga Tonga-Hunga Ha’apai volcano in the south Pacific getting some attention in the geobloggosphere, I thought for this return to Map Monday, why not look back at another "recently created island". Surtsey is probably the most famous example of a undersea volcano reaching the surface. It has since become an important "natural experiment" of colonization of life.
The above image is a geologic map of Surtsey by the The Surtsey Research Society. The principle craters, vents, fissures are denoted by red lines. The purple colors shows various lavas, browns are tuff and tephra, and the tans are talus slopes and sand deposits.
Map Information
Jakobsson, S. P. 2000. Geological map of Surtsey (scale 1:5.000). Icelandic Institute of Natural History and The Surtsey Research Society.
Posted by Chris M Sunday, February 8, 2009
Map Monday 11: Sea Level Change 1993-2008
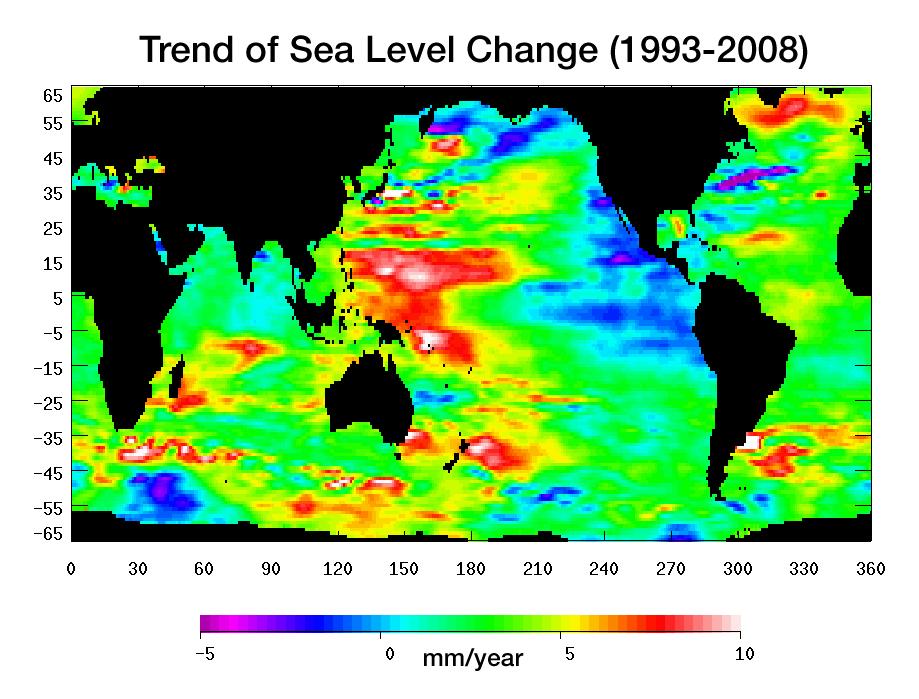
The week's Map Monday shows sea level changes 1993-2008. The data is based on two NASA/CNES satellites (Topex/Poseidon, Jason-1). White, red, and yellow areas show locations of increased sea level, while purple and blue show decreased sea level. The most obvious change is located in the western Pacific Ocean, reflecting the negative phase of the Pacific decadal oscillation (PDO). The PDO is similar to ENSO, except it can last for decades. It is also associated with weather events similar to ENSO, except not as extreme. During the negative phase of the PDO, the western Pacific is warmer, while the eastern Pacific cools (like La Niña).Map Information
PIA11002: Portrait of a Warming Ocean and Rising Sea Levels: Trend of Sea Level Change 1993-2008. 2008. NASA/JPL.
Posted by Chris M Monday, February 2, 2009
Map Monday #10: Darwin's South America Cross Sections
/1846_SouthAmerica_F273_283.jpg)
With February being the bicentennial of Darwin's birth and the 150th anniversary of On the Origin of Species, how about a map by Darwin. The above map shows three cross sections of the southern Andes. Included are not only elevations but simple bedrock types (granite, sandstone, etc...).
Map Information
Darwin, C. R. 1846. Plate 1. From Geological observations on South America. Being the third part of the geology of the voyage of the Beagle, under the command of Capt. Fitzroy, R.N. during the years 1832 to 1836. Smith Elder and Co.
Map from The Complete Work of Charles Darwin Online
Posted by Chris M Monday, January 26, 2009
Map Monday #9: Central Idaho and Western Montana Wolf Packs
The Gray Wolf (Canis lupus) has been busy for the past few months. Last year, some populations of the wolf were removed from the endangered species list, however, they were put back on later by a judge. In the last days of the Bush administration, they were again delisted. However, since Obama took office, this was reversed again.Although, wolves in the Yellowstone region get more attention, the largest population in the northern Rocky Mts is actually in central Idaho and western Montana. According to the latest public report, there are roughly 1,500 wolves in the northern Rocky Mts. Central Idaho/western Montana has 800 of these wolves, 450 are in the Yellowstone region, and 250 in northern Montana. The above map shows general locations of various wolf packs in central Idaho based on radio collar data. Maps are available for all three regions showing the wolf pack ranges.
Map Information
Central Idaho Wolf Recovery Area. 2008. From Rocky Mountain Wolf Recovery 2007 Interagency Annual Report.Prepared by Montana Fish, Wildlife, and Parks Information Services Division.
Posted by Chris M Monday, January 12, 2009
Map Monday #8: Streamgages in Antarctica
The McMurdo Dry Valleys are famous for their lack of ice cover and the strong katabatic winds that blow. But during the summer, it gets warm enough to melt some ice and create streams in the dry valleys. And where there is water to measure, the USGS is there. They even have a couple sites that have real time data online! The below map shows the sites of 20 stream gage sites within Taylor valley.
I just have to include the photograph of someone doing a discharge measurement! Maybe that can be me someday.... :-)

Streamgaging on Onyx River at Lake Vanda, Wright Valley, Antarctica. Photo by Chris Jaros, Institute of Arctic and Alpine Research.
Map Information
Locations of streamgages in the Taylor Valley, Antarctica. From Streamgaging in Antarctica. USGS Wyoming Water Science Center.
Posted by Chris M Monday, January 5, 2009
Map Monday #7: Iowa Isostatic Gravity Map

The further back into the earth's past you go, the less material exists and the harder it becomes to reconstruct the paleogeography. This makes understanding the creation of the cratons, the stable cores of continents, especially difficult. Although parts of the North American craton were cleaned of covering sediments by glaciation, some parts were further buried. However, techniques such as magnetic and gravity mapping allow us to glimpse what lies under covers of sediment and rock.
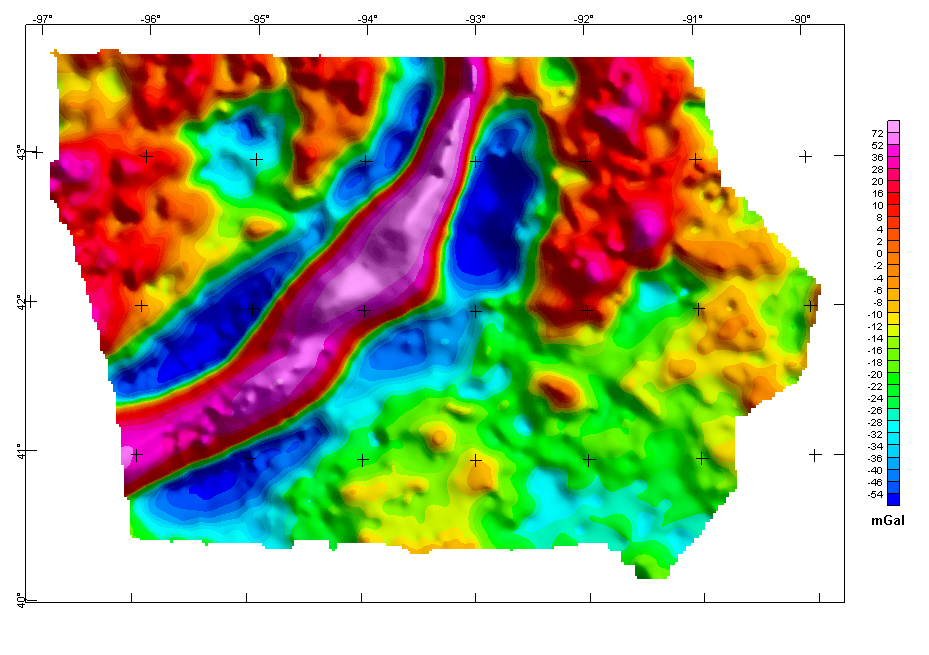
Above is a isostatic gravity map of Iowa. Locations of higher gravitational acceleration (recall g=mG/r2), are locations of denser rocks (oceanic rock), locations of lower gravitational acceleration are less dense rocks (continental). On the above map, red is higher acceleration and blue is lower acceleration.
The most obvious feature is the three "stripes" across central Iowa, consisting of a central high gravity stripe, and surrounding lower gravity stripe. The central high gravity stripe is the buried remains of the failed midcontinent rift. Roughly 1100 million years ago, the North American craton tried to rift, causing the stripe of heavy basalts, which were thrust up as the Iowa horst. The surrounding five basins were filled with lighter clastic sediments. The rift failed, but the gravity differences remain after 1100 million years.
Map Information
Iowa Isostatic Gravity Anomaly Map. From Iowa Magnetic and Gravity Maps and Data: A Web Site for Distribution of Data. Kucks, R. P. and Hill, P. L. USGS Data Series 135. 2005.
Posted by Chris M Monday, December 29, 2008
Map Monday #6: Seismicity Cross Section

As previously shown many times on the geoblogosphere, the USGS's earthquake site is a good site for recent and occurring earthquakes. While looking through the site I saw on November 24, 2008 at 09:02 UTC, a 7.3 magnitude quake happened in the Sea of Okhotsk, off the west coast of Kamchatka. Under the "seismic cross section" there is a great map illustrating the variation in quake depth at subduction zones. The November 24 quake was deep focus at a depth of 491 km, well into the Wadati-Benioff zone. The map shows the increasing depth of foci from the boundary, as the subducting plate moves deeper into the mantle.
Map Information
Seismic Cross Section for Magnitude 7.3 Sea of Okhotsk at
Monday, November 24, 2008 at 09:02:58 UTC. Preliminary Earthquake Report U.S. Geological Survey, National Earthquake Information Center World Data Center for Seismology, Denver.
Posted by Chris M Monday, December 22, 2008
Map Monday #5: Worldwide Glaciation

On this week's map Monday, it is back those hotbeds of early geologic research, glaciers and the Alps. Unlike the previous map that focused on glaciation in the Alps, this attempted to combine the presently known evidence of glaciation to produce a world wide map. The map includes inserts showing greater detail in the Alps, North American, and the south island of New Zealand. The largest maps are polar projections of both the north and south poles. Once again, the map is from the David Rumsey collection.
Map Information
Eisverbreitung, einst und jetzt. Polar Ansicht der Erde in Lambert's flachenrechter Azimuthal-projection . (with) Der Rhein-Gletscher nach A. Favre. (with) Der Rhone Gletscher nach A. Falsan. (with) Seen-Gebiet in Nord-Amerika nach Chamberlin und Wright. (with) Die Europaischen Alpen. (with) Iseo-Gletscher nach Stroppani. (with) Der Loisach- und Inn-Gletscher n. Penck & Bayberger. (with) Die Sudlichen Alpen (Neu-Seeland) nach J. v. Haast. Entw. v. Herm. Berghaus 1884, Ausg. 1886. Gotha: Justus Perthes (1892)
Posted by Chris M Monday, December 8, 2008
Map Monday #4: Mercator's North Pole

Gerardus Mercator was a pretty influential cartographer. In fact, when most people think of a map of the world, they think of Mercator's projection (for better or worse). One of Mercator's accomplishments was his 1595 posthumously published atlas, Atlantis pars altera.
As you would expect from a map from 1595 there are some major issues. His northern America has no connection with reality, Greenland is smaller, and an island (Frisland) has appeared between Iceland and Greenland. What is most interesting his his depiction of the geographic north pole and his two magnetic north poles. The below is Mercator describing the geographic north pole and one of the magnetic north poles.
In the midst of the four countries is a Whirl-pool . . . into which there empty these four indrawing Seas which divide the North. And the water rushes round and descends into the earth just as if one were pouring it through a filter funnel. It is four degrees wide on every side of the Pole, that is to say eight degrees altogether. Except that right under the Pole there lies a bare rock in the midst of the Sea. Its circumference is almost 33 French miles, and it is all of magnetic stoneMercator's other magnetic north pole is located in the present day Chukchi Sea north of the Bering Strait.
Map Information
Septentrionalium Terrarum descriptio from Atlantis pars altera. Mercator, Gerhard. 1595.
Posted by Chris M Monday, December 1, 2008
Map Monday #3: Titan Topography
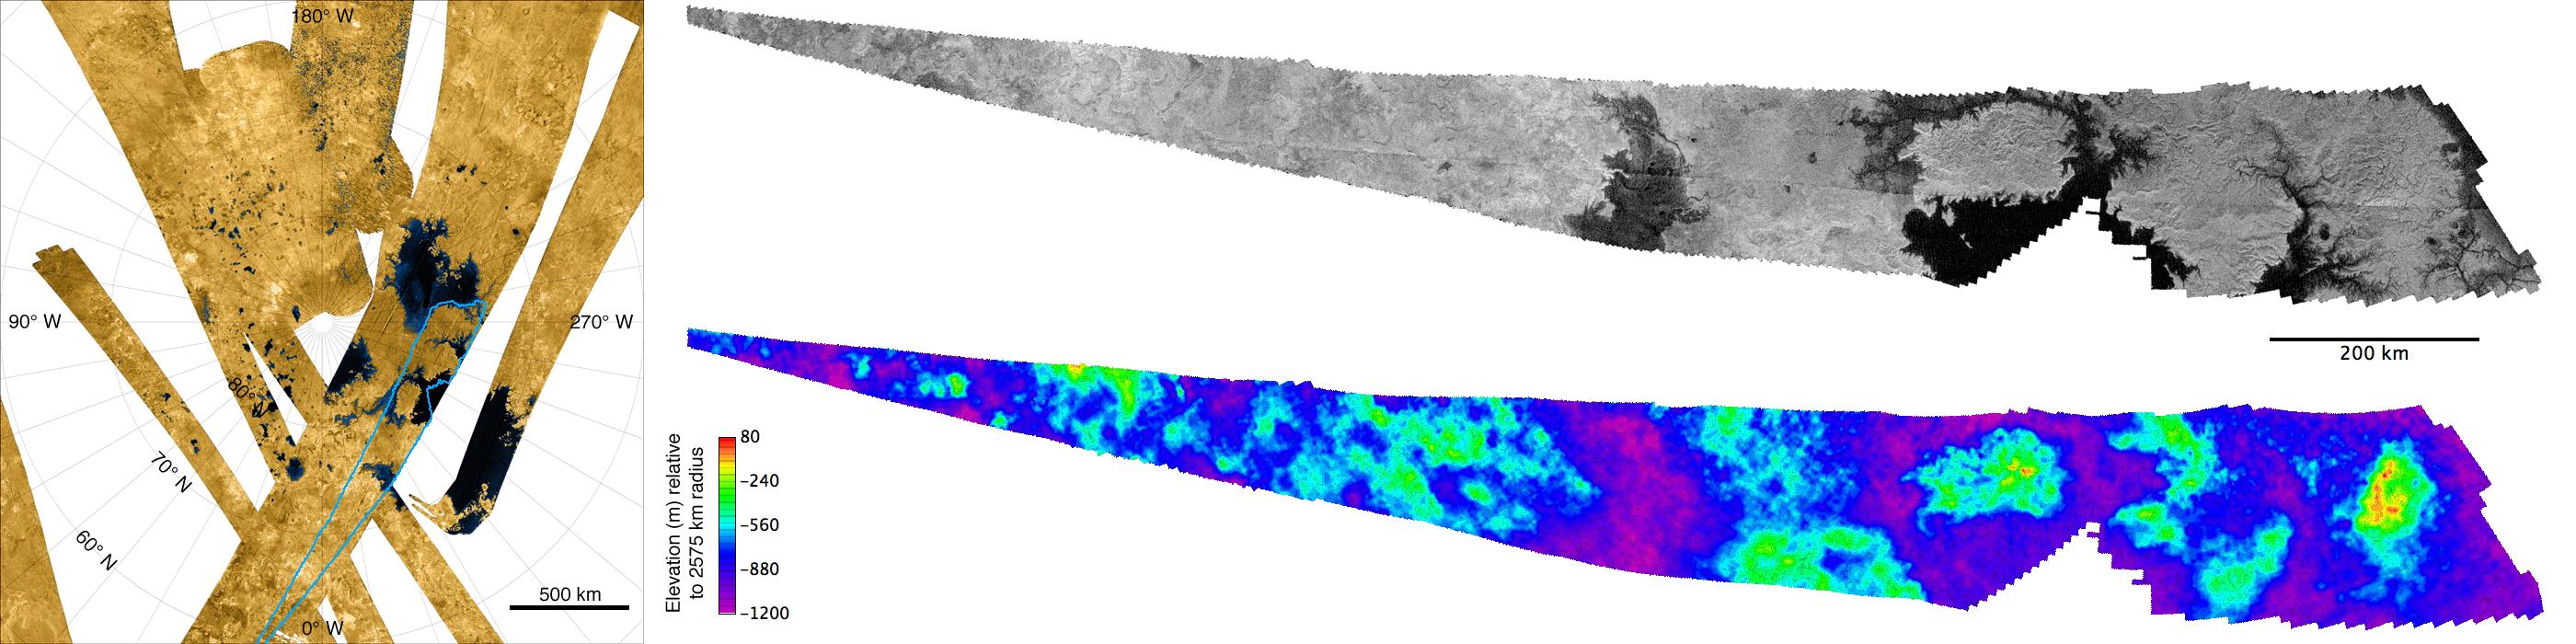
So the first two weeks have been 19th century maps. Why not something much more recent? The above image are elevations of Titan (on of Saturn's moons) obtained by the Cassini space probe in 2007. The top half is a radar scan of part of Titan's north pole. This has been converted into a DEM and transformed into a topographic image of elevations on the bottom half. You really need to click on the image to get a good view.
Posted by Chris M Monday, November 24, 2008
Map Monday #2: Glaciers of the Alps

One of the first important research foci of early (19th century) geology was the Alps and their associated glaciers. People like De Saussure and Agassiz were climbing around the mountains (helping to invent the sport of mountaineering) trying to understand the processes involved.
This week's map is from 1854 and illustrates features of several Alpine glaciers. Not only is the speed of the glacier shown, but also the location of moraines and erratic boulders. These features were the first evidence of ice ages in the earth's past.
Just like last week's map, this is from the David Rumsey Collection.
Illustrations of the glacier systems of the Alps and of glacial phenomena in general. From the surveys and sketches of Professor Forbes, the maps of Raymond, Weiss, Charpentier &c., by A.K. Johnston, F.R.S.E. Engraved by W. & A.K. Johnston. William Blackwood & Sons, Edinburgh & London. 1st. November 1854. (1856)
Posted by Chris M Monday, November 17, 2008
Map Monday #1: Lake Bonneville
The map is of the pluvial Lake Bonneville, completed during the Wheeler Survey, one of the large "west of the 100th meridian" surveys that helped to establish the USGS in the 1870s. The data for the map was gathered in part by the great 19th century geomorphologist, G. K. Gilbert. The map is part of the David Rumsey Map Collection. Click on the image for a larger look. If you also have time, check out this neat little flash "brief history of Lake Bonneville" from the Utah State Geological Survey.

Restored Outline Of Lake Bonneville. Geological Data By G.K. Gilbert & E.E. Howell. J. Bien lith. Portions Of Western Utah & Eastern Nevada. Expeditions of 1869, 1871, 1872 & 1873 Under the Command of 1st. Lieut. Geo. M. Wheeler, Corps of Engineers, U.S. Army. U.S. Geographical Surveys West Of The One-Hundredth Meridian. (1876)