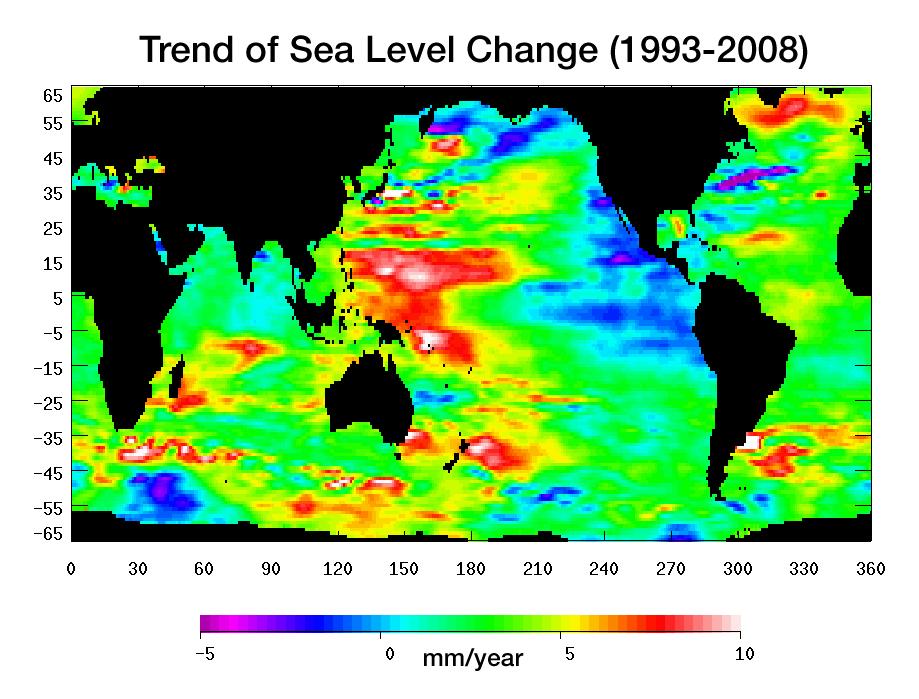
 The week's Map Monday shows sea level changes 1993-2008. The data is based on two NASA/CNES satellites (Topex/Poseidon, Jason-1). White, red, and yellow areas show locations of increased sea level, while purple and blue show decreased sea level. The most obvious change is located in the western Pacific Ocean, reflecting the negative phase of the Pacific decadal oscillation (PDO). The PDO is similar to ENSO, except it can last for decades. It is also associated with weather events similar to ENSO, except not as extreme. During the negative phase of the PDO, the western Pacific is warmer, while the eastern Pacific cools (like La Niña).
Map Information
PIA11002: Portrait of a Warming Ocean and Rising Sea Levels: Trend of Sea Level Change 1993-2008. 2008. NASA/JPL.
1 comments:
Gratteful for sharing this
Post a Comment