Posted by Chris M Monday, December 29, 2008
Map Monday #6: Seismicity Cross Section
As previously shown many times on the geoblogosphere, the USGS's earthquake site is a good site for recent and occurring earthquakes. While looking through the site I saw on November 24, 2008 at 09:02 UTC, a 7.3 magnitude quake happened in the Sea of Okhotsk, off the west coast of Kamchatka. Under the "seismic cross section" there is a great map illustrating the variation in quake depth at subduction zones. The November 24 quake was deep focus at a depth of 491 km, well into the Wadati-Benioff zone. The map shows the increasing depth of foci from the boundary, as the subducting plate moves deeper into the mantle.
Map Information
Seismic Cross Section for Magnitude 7.3 Sea of Okhotsk at
Monday, November 24, 2008 at 09:02:58 UTC. Preliminary Earthquake Report U.S. Geological Survey, National Earthquake Information Center World Data Center for Seismology, Denver.
Posted by Chris M Monday, December 22, 2008
Map Monday #5: Worldwide Glaciation
On this week's map Monday, it is back those hotbeds of early geologic research, glaciers and the Alps. Unlike the previous map that focused on glaciation in the Alps, this attempted to combine the presently known evidence of glaciation to produce a world wide map. The map includes inserts showing greater detail in the Alps, North American, and the south island of New Zealand. The largest maps are polar projections of both the north and south poles. Once again, the map is from the David Rumsey collection.
Map Information
Eisverbreitung, einst und jetzt. Polar Ansicht der Erde in Lambert's flachenrechter Azimuthal-projection . (with) Der Rhein-Gletscher nach A. Favre. (with) Der Rhone Gletscher nach A. Falsan. (with) Seen-Gebiet in Nord-Amerika nach Chamberlin und Wright. (with) Die Europaischen Alpen. (with) Iseo-Gletscher nach Stroppani. (with) Der Loisach- und Inn-Gletscher n. Penck & Bayberger. (with) Die Sudlichen Alpen (Neu-Seeland) nach J. v. Haast. Entw. v. Herm. Berghaus 1884, Ausg. 1886. Gotha: Justus Perthes (1892)
Posted by Chris M Thursday, December 18, 2008
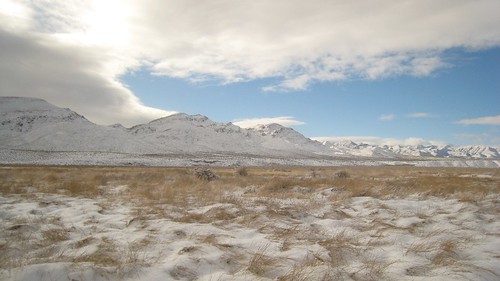
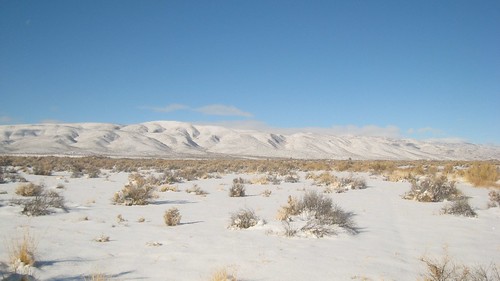
Snow on the valley floor
The week saw a couple of storms with very low snow levels, down to some Mojave valley floors. Even Las Vegas got 3.6 in of snow, the most since 1979! Now, some places in Nevada do get snow (it is the name), but it is unusual for my location. In my own neck of the
The back end of the storm system this morning.
That isn't salt in the foreground.
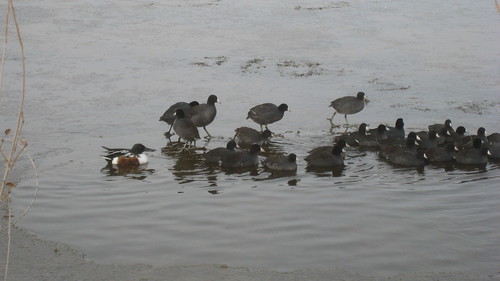
One Northern Shoveler and several American Coots gather in the only ice free part of a pond.
Posted by Chris M Monday, December 8, 2008
Map Monday #4: Mercator's North Pole
Gerardus Mercator was a pretty influential cartographer. In fact, when most people think of a map of the world, they think of Mercator's projection (for better or worse). One of Mercator's accomplishments was his 1595 posthumously published atlas, Atlantis pars altera.
As you would expect from a map from 1595 there are some major issues. His northern America has no connection with reality, Greenland is smaller, and an island (Frisland) has appeared between Iceland and Greenland. What is most interesting his his depiction of the geographic north pole and his two magnetic north poles. The below is Mercator describing the geographic north pole and one of the magnetic north poles.
In the midst of the four countries is a Whirl-pool . . . into which there empty these four indrawing Seas which divide the North. And the water rushes round and descends into the earth just as if one were pouring it through a filter funnel. It is four degrees wide on every side of the Pole, that is to say eight degrees altogether. Except that right under the Pole there lies a bare rock in the midst of the Sea. Its circumference is almost 33 French miles, and it is all of magnetic stoneMercator's other magnetic north pole is located in the present day Chukchi Sea north of the Bering Strait.
Map Information
Septentrionalium Terrarum descriptio from Atlantis pars altera. Mercator, Gerhard. 1595.
Posted by Chris M Tuesday, December 2, 2008
Titan Cryovolcanism
Little did I know yesterday, but Titan is also the subject of this month's planetary geomorphology image of the month from the IAG. The image shows cryovolcanism on the surface of Titan, particularly Ganesa Macula, a possible shield volcano. Cryovolcanoes are like their counterparts on earth, except they erupt "cold" materials such as water or ammonia.
Posted by Chris M Monday, December 1, 2008
Map Monday #3: Titan Topography
So the first two weeks have been 19th century maps. Why not something much more recent? The above image are elevations of Titan (on of Saturn's moons) obtained by the Cassini space probe in 2007. The top half is a radar scan of part of Titan's north pole. This has been converted into a DEM and transformed into a topographic image of elevations on the bottom half. You really need to click on the image to get a good view.
Posted by Chris M Monday, November 24, 2008
Map Monday #2: Glaciers of the Alps
One of the first important research foci of early (19th century) geology was the Alps and their associated glaciers. People like De Saussure and Agassiz were climbing around the mountains (helping to invent the sport of mountaineering) trying to understand the processes involved.
This week's map is from 1854 and illustrates features of several Alpine glaciers. Not only is the speed of the glacier shown, but also the location of moraines and erratic boulders. These features were the first evidence of ice ages in the earth's past.
Just like last week's map, this is from the David Rumsey Collection.
Illustrations of the glacier systems of the Alps and of glacial phenomena in general. From the surveys and sketches of Professor Forbes, the maps of Raymond, Weiss, Charpentier &c., by A.K. Johnston, F.R.S.E. Engraved by W. & A.K. Johnston. William Blackwood & Sons, Edinburgh & London. 1st. November 1854. (1856)
Posted by Chris M Monday, November 17, 2008
Map Monday #1: Lake Bonneville
The map is of the pluvial Lake Bonneville, completed during the Wheeler Survey, one of the large "west of the 100th meridian" surveys that helped to establish the USGS in the 1870s. The data for the map was gathered in part by the great 19th century geomorphologist, G. K. Gilbert. The map is part of the David Rumsey Map Collection. Click on the image for a larger look. If you also have time, check out this neat little flash "brief history of Lake Bonneville" from the Utah State Geological Survey.
Restored Outline Of Lake Bonneville. Geological Data By G.K. Gilbert & E.E. Howell. J. Bien lith. Portions Of Western Utah & Eastern Nevada. Expeditions of 1869, 1871, 1872 & 1873 Under the Command of 1st. Lieut. Geo. M. Wheeler, Corps of Engineers, U.S. Army. U.S. Geographical Surveys West Of The One-Hundredth Meridian. (1876)
Posted by Chris M Sunday, November 9, 2008
Desert Lake and Dune Field
Last weekend I took a trip to Desert Lake located in the Desert National Wildlife Refuge. The lake is a large dry playa located in Desert Valley, an endorheic basin. An endorheic basin, also known as a closed basin, has no water exiting or leaving it. The valley itself is located on the southern side of the larger endorheic Great Basin. Because of the unique names of the playa and valley, I haven't been able to find much published literature about the area.
Desert Valley drains an area starting at the Groom and Tikaboo ranges near Rachel, through Nellis Air Force Range, before terminating at Desert Lake.
Although it was wetter in the area during the Pleistocene and may well have sustained a permanent lake, now the area receives less than 15 cm of rainfall a year. The frequency of induation of this playa, like most playas, is probably unknown (Lichvar et al. 2004)
There are lots of playas in southern Nevada, but desert is more unique because of its associated sand dunes. To the east of the lake is the Sheep Range, a 1,500-2,000 m mountain range of Cambrian to Devonian dolmite and limestone (Jayko, 2007). Along with predominately westerly winds, this allows the formation of a dune field.
This process is also illustrated on the larger and more famous Great Sand Dunes National Park. As seen in this image from the park's website, winds blow the deposited sand west until it is again deposited at the base of the mountains. Winds blowing through mountains passes from the east help to pile the sand into dunes. For much more information about the Great Sand Dunes see a recent paper in Geomorphology (Madole et al., 2008).
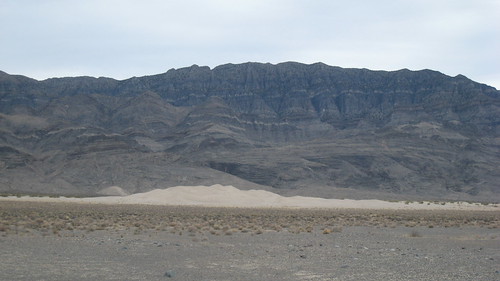
I estimated the tallest dunes as > 20 m. The Dune Field covers only a few square km of land, however, the surrounding area is quite sand, but is mostly covered in vegetation. The dunes themselves are only sparsely vegetated with Ambrosia eriocentra (woolly bursage) and Chilopsis linearis (desert willow). The dune field is one of the northernmost natural occurses of C. linearis (Ackerman, 2003).
Finally, just for fun, here is a shot of some ripples on the dunes and check out geology.aboout.com's recent visit to the Kelso Dunes in California.
References:
Ackerman, T. L. 2003. A Flora of the Desert National Wildlife Range, Nevada. Mentzelia 7:1-89.
Jayko, A. S. 2007. Geologic Map of the Pahranagat Range 30' × 60' Quadrangle, Lincoln and Nye Counties, Nevada. US Geological Survey.
Lichvar, R., Gustina, G., Bolus, R. 2004. Ponding duration, ponding frequency, and field indicators: A case study on three California, USA, playas. Wetlands 24:406–413.
Madole, R. F., Romig, J. H., Aleinikoff, J. N., VanStistine, D. P., Yacob, E. Y. 2008. On the origin and age of the Great Sand Dunes, Colorado. Geomorphology 99:99-119.
Posted by Chris M
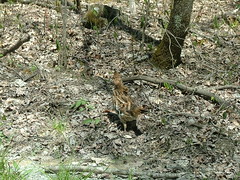
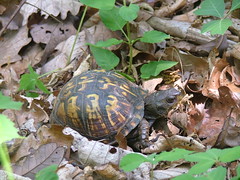
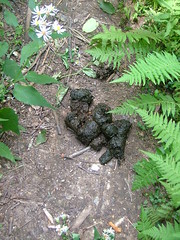
Animals in the field
Ruffled Grouse
Eastern Box Turtle
Ok, this isn't really an animal, just the evidence of one. Black bear scat.
Posted by Chris M Tuesday, October 28, 2008
Global ground water
It has the entire globe and continents available as pdfs. It also has a web based mapping interface, that isn't currently working for me.
Posted by Chris M Saturday, October 25, 2008
Favorite trees
I could do an entire blog of my favorite trees, but two particular species stand out for me. First, is Aesculus flava (Yellow Buckeye). Although I had seen the species many times before, it wasn't until going to the headwaters of Dunn Creek in the Great Smoky Mountains during my thesis field work that I became awestruck by it. By wood volume, the tree may be in the top six largest species in the eastern US (Tsuga canadensis, Liriodendron tulipifera, Pinus strobus, Taxodium distichum, Quercus virginiana, Aesculus flava?). When it grows in a forest situation, it develops a powerful straight bole that slowly tapers with height. Below are four +4.5 m CBH trees I found near or at my field sites.
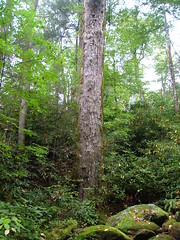
My other favorite tree has to be Pinus virginiana (Virginia Pine). If you ever climb a rocky ridge in Appalachia, you will find it. Although it can grow on better sites, its classic home is a rock ledge, exposed to the wind and sun, growing in almost no soil. Unlike most pines that have a straight bole until they get old, Virginia pine starts out twisted and gnarly when young. When you combine the tree with its rocky and exposed homes, I imagine a tough individual that takes the worst nature can give, yet still grows and maintains a unique individuality. It is so tough, it is commonly planted on old coal strip mines where little else will grow. Below is one growing out of a sandstone ledge along the Big South Fork River.
Posted by Chris M Thursday, October 23, 2008
Online textbook
I am always happy when I see another journal or textbook going online for free.
The USGS has put the textbook Unsaturated Zone Hydrology for Scientists and Engineers, downloadable for free on their website. However, it is not in the public domain.
I have only had a chance to read a couple chapters, but so far so good (as far as textbooks go...). It is geared for upper level undergraduates and graduates students.
And the cover is excellent (definitely look at a bigger view).
Hat tip to Waterwired.
Posted by Chris M Monday, October 6, 2008
Fun with a camera and a scope
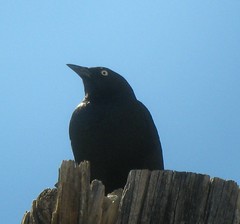
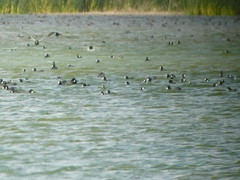
My shots of a group of American coot didn't turn out so well...
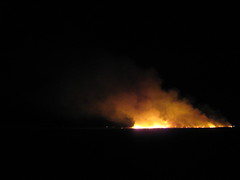
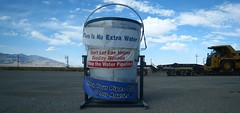
Finally, a night shot of a controlled burn on the refuge and an anti-Southern Nevada Water Authority display from near Baker, NV.
Posted by Chris M Wednesday, October 1, 2008
Wild and Scenic Rivers Act
It is hereby declared to be the policy of the United States that certain selected rivers of the Nation which, with their immediate environments, possess outstandingly remarkable scenic, recreational, geologic, fish and wildlife, historic, cultural, or other similar values, shall be preserved in free-flowing condition, and that they and their immediate environments shall be protected for the benefit and enjoyment of present and future generations.Today, over 11,000 miles of 165 rivers are protect by the act. I couldn't find a good map showing all the rivers, so I created one.
So if you can, go out and enjoy a river tomorrow.
Posted by Chris M Tuesday, September 23, 2008
Geology of Pluto
There is a lot of sexy stuff to talk about, but I thought, what about a space body that has been through some tough times recently. Pluto used to be a planet, the select club of only 8 other members in our solar system. But in 2006 it was downgraded to just a dwarf planet. It deserves some attention.
The hardest thing about studying the geology of Pluto is the distance. Pluto is at a minimum 4.28 billion km from earth. A little to far for a rock hammer. At that distance, even satellites have problems.
First, what is Pluto made of? Using spectroscopy, Pluto's surface has been determined to be mostly frozen N2 with a small amounts of CH4 and CO. Based on its density, Pluto is thought to have a solid rock core. The radioactive decay from this core could be enough to melt the bottom of Pluto's frozen surface, resulting in a layer of liquid between the core and surface.
Pluto's surface, however, is not flat and featureless, as Hubble images have reveled. Pluto has locations of varying albedo that are probably a result of not only surface frost, but also impact craters.
Despite Pluto's great distance from the sun, its atmosphere's composition is still controlled by the sun. Just like with ice caps on Earth, although the sun may not have enough energy to melt the frozen material, it can sublimate some of it. Because of this sublimation, Pluto's atmosphere has a similar composition to its surface. Pluto, like Saturn's moon, Titan, Neptune's moon, Triton, and the Earth, has a N2 dominated atmosphere. However, this atmosphere is sparse, at only 3 microbars of pressure versus the Earth's average of 10130 microbars. Because of Pluto's thin atmosphere and great distance from the sun, the average surface temperature is only 40 Kelvin.
Pluto has not been forgotten. In 2006, the New Horizons mission was launched to study Pluto and the Kuiper belt. Pluto won't be reached 2015, but the satellite should great expand our knowledge of Pluto, the distant
References
NASA's New Horizons Mission. What We Know About Pluto, Charon and the
Kuiper Belt. http://pluto.jhuapl.edu/science/whatWeKnow.html
Owen, T. C., Roush, T. L., Cruikshank, D. P., Elliot J. L., Young, L. A., De Bergh, C., Schmitt, B., Geballe, T. R., Brown, R. H., Bartholomew, M. J. 1993. Surface Ices and the Atmospheric Composition of Pluto. Science 261(5122): 745 - 748.
Stern, A., Buie, M. 1996. Hubble Reveals Surface of Pluto for First Time. Hubble Newscenter. http://hubblesite.org/newscenter/archive/releases/1996/09/
Williams, D. R. 2006. Pluto Fact Sheet. NASA Planetary Fact Sheets. http://nssdc.gsfc.nasa.gov/planetary/factsheet/plutofact.html
Posted by Chris M
Ancient Permafrost
The current issue of Science has a short article about a 740,000 year old ice wedge found in a section of permafrost in Yukon, Canada [Froese et al., 2008].
An ice wedge is a vertically oriented section of ice the forms in periglacial environments. Water enters a crack in the soil and then freezes, forms an ice wedge, and expands the soil crack further, making the wedge larger (check out this cool animation). It is associated with permafrost.
As the climate warms, there are concerns that melting permafrost will release large amounts of CO2 [Zimov et al., 2006]. However, we don't know exactly how permafrost and related periglacial features will react to warmer temperatures.
The researchers found an ice wedge under a volcanic ash layer, thereby predating the ash layer. The ash layer was dated to over 700,000 years ago. Not only does this make this ice wedge the oldest dated ice in North America, but it shows that ice has survived warmer interglacial periods in the past.
References
Froese, D. G., Westgate, J. A., Reyes, A. V., Enkin, R. J., Preece, S. J. 2008. Ancient Permafrost and a Future, Warmer Arctic. Science 321(5896): 1648.
Zimov, S. A., Schurr, E. A. G., Chapin III, F. S. 2006. Permafrost and the Global Carbon Budget. Science 312(5780): 1612-1613.
Image: Agriculture and Agri-Food Canada
Posted by Chris M Sunday, September 14, 2008
Alexander von Humboldt
We have Darwin Day, why not Alexander von Humboldt day (September 14)? If you ask for the greatest natural scientist (a term not used until much later) in the 19th century, you would probably get Darwin. How about number two?
In these days of specialization, the range of topics people like von Humboldt examined is remarkable. Geography, volcanology, mineralogy, electromagnetism, biology, meteorology, and oceanography were all impacted by his work. On his famous South American travels, which later influenced Darwin on his journey on the Beagle, von Humboldt proved the link between the Amazon and Orinoco Rivers, found the earth's magnetic field decreased from the poles to the equator, and nearly reached the top of Chimborazo, what was then thought to be the tallest mountain the world.
The image below is a copy of his diagram of Chimborazo. Not only is it a beautiful image, but it also contains loads of information he gathered while climbing the peak. This includes data about altitude, appearance of electricity, vegetation, changes in weight, blueness of the sky, animals, location of the snowline, the boiling point of water, and atmospheric pressure, temperature, humidity, and composition. The site hosting it has even translated some of the German notes in English. So go take a look this von Humboldt day!
Posted by Chris M Sunday, August 10, 2008
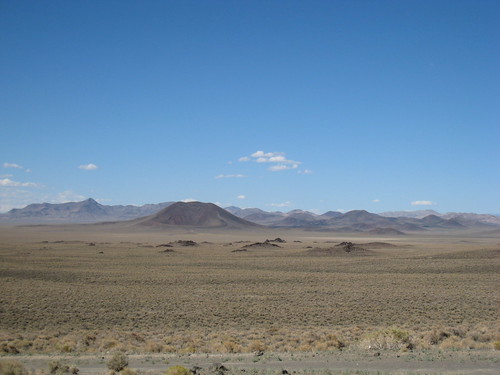
Lunar Crater Volcanic Field
The field is approximately 10 km wide and 40 km long and is composed of a number of cinder cones, basalt flows, and at least two maars. Maars are low relief craters formed by the expansion of steam from the contact between magma and ground water, or by the expansion of magmatic gas. Lunar crater is a nearly circular maar 130 m deep and 1,050 m wide. The other maar in the field is named Easy Chair Crater and is located only a few km to the north.
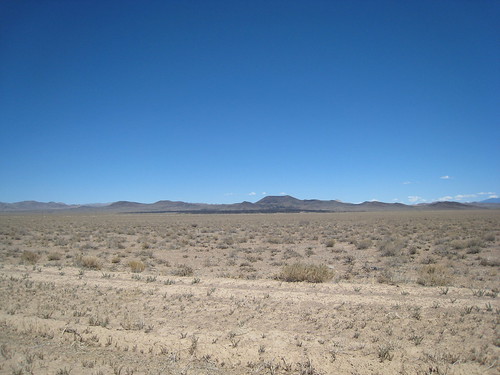
The field was created during at least three active volcanic periods in the late Pliocene and Pleistocene (4 million - 15,000 years before present) as evidenced by three distinct basalt flows. The oldest flow is mostly covered with sand and vegetation [Sagebrush (Artemisia sp.) and Joinfir (Ephedra nevadensis)], but are exposed as the cliffs in lunar crater as the explosive steam broke its way through this oldest deposit. The intermediate flow has a thin sandy soil cover, less vegetation and is associated with the episode that created the two maars. The youngest flow is located at the north end of the field and has little to no soil or vegetation covering it, visible as the black patch in the below photo.
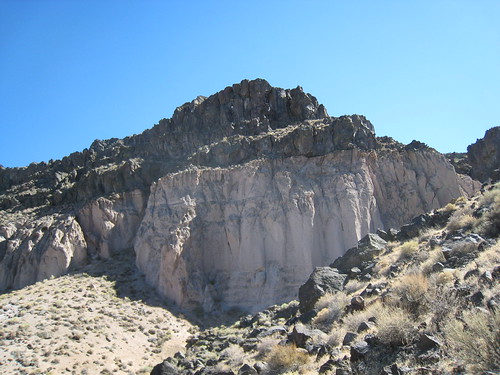
Lunar crater's most interesting features are a dike extending from the south side of the crater to a small cinder cone (opposite in above crater photo) and a playa-alluvial fan that has developed from a ephemeral stream that incised into a rhyolite and tuff layer. The fan-playa system has the expected decrease in particle size as you move from the fanhead to the playa. Because of the steep slope around the base of the crater, few or no cattle have appeared to have made it onto the crater floor, so the vegetation looks mostly undistributed. Salt tolerate greaswood (Sarcobatus vermiculatus) is found on the playa, sagebrush on the gravely fan, and a few currant (Ribes sp.) in the shadier and wetter site at the fanhead amongst boulders from the rhyolite and tuff.
Source:
Scott, D. and Trask, N. 1971. Geology of the Lunar Crater Volcanic Field, Nye County, Nevada. US Geological Survey Professional Paper 599-1.
Posted by Chris M Thursday, August 7, 2008
Geoscience careers in Science
When hydrogeologists talk about their field, one word keeps coming up: "recession-proof." While geologists in the energy and mineral industries face roller-coaster hiring-and-firing cycles, those who study the movement and chemistry of water seeping through rocks and sediment find demand for their expertise almost as steady as the flow of groundwater itself.
Posted by Chris M Friday, July 11, 2008
A few more Owens valleys?
I haven't posted in a while. My excuse is new job + lack of personal internet = few postings. Hopefully, I can do some good post about my job and its interesting setting in the not to distant future. This post will give some background to the area I am working in.
Las Vegas is the fourth fastest growing city in the US. Its population is expected to double in the next 30 years. As can be expected with a rapidly expanding city, its demand for water is also ballooning. However, with a drying Lake Mead, Las Vegas’s current water source, the city is looking for other options. With every other river in the vicinity already tapped, they are looking at ground water.
Parts of eastern Nevada and western Utah are underlain by large areas of carbonate rock that form the Great Basin aquifer. The aquifer's water currently is released in numerous springs that provide unique habitats in the middle of the desert, irrigation water, and municipal water for several small towns.
Las Vegas, hungry for the water in this aquifer, have bought up water rights in numerous Great Basin valleys for the stated desire to pump large amounts of water out of these valleys to feed its growing population.
On Wednesday, Nevada’s state engineer approved the Southern Nevada Water Authority (basically Las Vegas) to pump over 18,000 acre-feet of water, half of what SNWA wanted, from three valleys in Nevada’s Lincoln County. This is only one chunk of water that SNWA wants to pump. It is also seeking 50,000 acre-feet from Snake Valley, the site of Great Basin National Park.
The valleys to be pumped are located to the east of me and are connected to the same aquifer that is the source for the water at my job location. I am quite skeptical of the claims that the huge amount of water to be pumped won’t affect current ground water levels. I hope this doesn’t result in a few more Owens valleys. More posts on this later.
Waterwired has some more information.
Posted by Chris M Monday, May 19, 2008
Where on (Google) Earth #126
Winner is the first to post the location (latitude, longitude) and tells a little about the geology.
No Schott Rule for this one...
Posted by Chris M Tuesday, May 6, 2008
USGS to release Landsat Archive for no cost
the USGS is pursuing an aggressive schedule to provide users with electronic access to any Landsat scene held in the USGS-managed national archive of global scenes dating back to Landsat 1, launched in 1972.
Posted by Chris M Monday, April 21, 2008
River measurement
At each monitoring site, a gaging station is located. The gaging station measures the height of the water, also known as the gage height, relative to some feature unique to that site. For this reason, the gage height can't be compared between different stations. One station's flood gage height may be another's low water gage height. The image to the left shows one possible instrument that is measuring the water height by measuring the height of water in the instrument that is also connected to the stream. However, this can not be done in all situations so a variety of different methods can be used.
The next step is to measure velocity. Velocity is difficult to measure because the water flow in the channel is not laminar as it interacts with the stream channels. The way around this is to measure the velocity in a series of sections, and using these various measures to find velocity. With stream water velocity and the the size of each section, the discharge, or the amount of water flowing through the stream channel over a period of time can be calculated.
Of course, it is not possible to measure velocity and calculated discharge all the time, so discharge measurements are combined with gage heights. With enough discharge measurements and gage heights a stage-discharge curve, also known as a rating curve, can be created. The rating curve allows discharges and gage heights to be predicted. However, rating curves are statistical interpolations, and may not reflect the reality of the stream. The are normally plotted log-linear so the rating curve is straight.
The final terminology used is flood stage. Flood stage is best defined as when the river fills its stream channel and starts to also flow on the surrounding floodplain. What a flood actually is (most places don't look like the lower Mississippi River) is a subject for another post.