The Gray Wolf (Canis lupus) has been busy for the past few months. Last year, some populations of the wolf were removed from the endangered species list, however, they were put back on later by a judge. In the last days of the Bush administration, they were again delisted. However, since Obama took office, this was reversed again.
Although, wolves in the Yellowstone region get more attention, the largest population in the northern Rocky Mts is actually in central Idaho and western Montana. According to the latest public report, there are roughly 1,500 wolves in the northern Rocky Mts. Central Idaho/western Montana has 800 of these wolves, 450 are in the Yellowstone region, and 250 in northern Montana. The above map shows general locations of various wolf packs in central Idaho based on radio collar data. Maps are available for all three regions showing the wolf pack ranges.
Map Information
Central Idaho Wolf Recovery Area. 2008. From Rocky Mountain Wolf Recovery 2007 Interagency Annual Report.Prepared by Montana Fish, Wildlife, and Parks Information Services Division.
Posted by Chris M Monday, January 26, 2009
Map Monday #9: Central Idaho and Western Montana Wolf Packs
Posted by Chris M Monday, January 12, 2009
Map Monday #8: Streamgages in Antarctica
When you think of collecting some data in Antarctica, the cryosphere or maybe some seismology is probably what comes to mind. How about some stream discharge measurements?
The McMurdo Dry Valleys are famous for their lack of ice cover and the strong katabatic winds that blow. But during the summer, it gets warm enough to melt some ice and create streams in the dry valleys. And where there is water to measure, the USGS is there. They even have a couple sites that have real time data online! The below map shows the sites of 20 stream gage sites within Taylor valley.
I just have to include the photograph of someone doing a discharge measurement! Maybe that can be me someday.... :-)
Streamgaging on Onyx River at Lake Vanda, Wright Valley, Antarctica. Photo by Chris Jaros, Institute of Arctic and Alpine Research.
Map Information
Locations of streamgages in the Taylor Valley, Antarctica. From Streamgaging in Antarctica. USGS Wyoming Water Science Center.
Posted by Chris M Monday, January 5, 2009
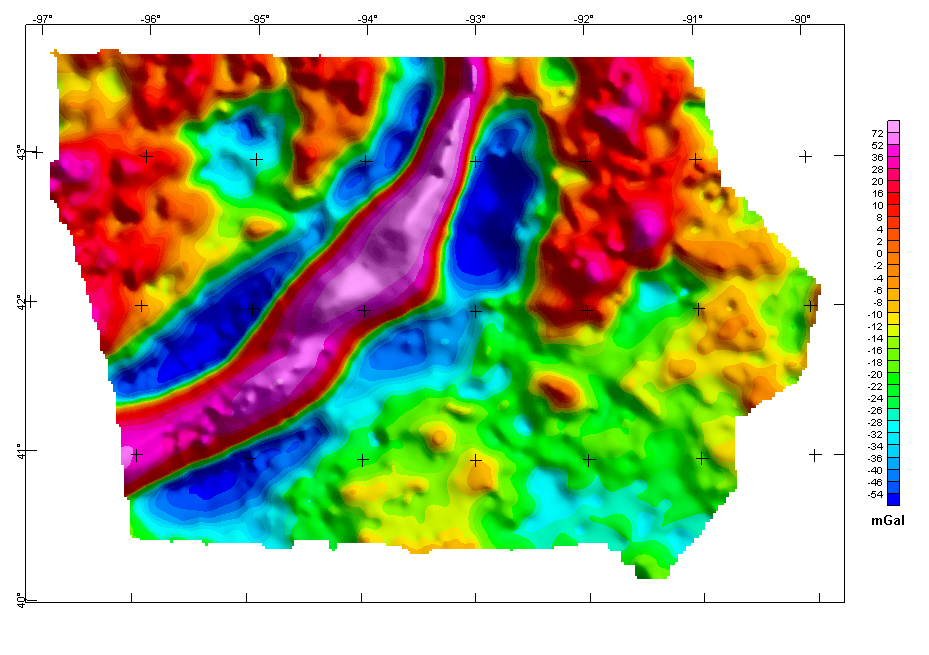
Map Monday #7: Iowa Isostatic Gravity Map
The further back into the earth's past you go, the less material exists and the harder it becomes to reconstruct the paleogeography. This makes understanding the creation of the cratons, the stable cores of continents, especially difficult. Although parts of the North American craton were cleaned of covering sediments by glaciation, some parts were further buried. However, techniques such as magnetic and gravity mapping allow us to glimpse what lies under covers of sediment and rock.
Above is a isostatic gravity map of Iowa. Locations of higher gravitational acceleration (recall g=mG/r2), are locations of denser rocks (oceanic rock), locations of lower gravitational acceleration are less dense rocks (continental). On the above map, red is higher acceleration and blue is lower acceleration.
The most obvious feature is the three "stripes" across central Iowa, consisting of a central high gravity stripe, and surrounding lower gravity stripe. The central high gravity stripe is the buried remains of the failed midcontinent rift. Roughly 1100 million years ago, the North American craton tried to rift, causing the stripe of heavy basalts, which were thrust up as the Iowa horst. The surrounding five basins were filled with lighter clastic sediments. The rift failed, but the gravity differences remain after 1100 million years.
Map Information
Iowa Isostatic Gravity Anomaly Map. From Iowa Magnetic and Gravity Maps and Data: A Web Site for Distribution of Data. Kucks, R. P. and Hill, P. L. USGS Data Series 135. 2005.
Posted by Chris M Thursday, January 1, 2009
Earth Impact Simulator
Although this has been around for a few years, I just learned about this neat earth impact simulator from the University of Arizona's Department of Planetary Sciences. You enter your distance from the impact and the earth material the projectile hits, along with the size, density, angle, and speed of the projectile. It returns some of the effects of such an impact.
I went with
With such an impact, the results would be
I am toast, literally!
There is even a paper describing how the simulator was created!
Collins, G. S., Melosh, H.J., Marcus, R. A. 2005. Earth Impact Effects Program: A Web-based computer program for calculating the regional environmental consequences of a meteoroid impact on Earth. Meteoritics & Planetary Science 40(6):817–840.
I went with
Distance from Impact: 100.00 km = 62.10 miles
Projectile Diameter: 2000.00 m = 6560.00 ft = 1.24 miles
Projectile Density: 1000 kg/m3
Impact Velocity: 51.00 km/s = 31.67 miles/s
Impact Angle: 45 degrees
Target Density: 1000 kg/m3
Target Type: Liquid Water of depth 10.00 meters, over typical rock.
With such an impact, the results would be
Final Crater Diameter: 29.3 km = 18.2 miles
Visible fireball radius: 34.2 km = 21.2 miles
The fireball appears 77.7 times larger than the sun
Much of the body suffers third degree burns
The major seismic shaking will arrive at approximately 20 seconds.
Richter Scale Magnitude: 8.7
The ejecta will arrive approximately 144 seconds after the impact.
Average Ejecta Thickness: 1.36 m = 4.45 ft
The air blast will arrive at approximately 303 seconds.
Peak Overpressure: 844000 Pa = 8.44 bars = 120 psi
Max wind velocity: 693 m/s = 1550 mph
I am toast, literally!
There is even a paper describing how the simulator was created!
Collins, G. S., Melosh, H.J., Marcus, R. A. 2005. Earth Impact Effects Program: A Web-based computer program for calculating the regional environmental consequences of a meteoroid impact on Earth. Meteoritics & Planetary Science 40(6):817–840.
Subscribe to:
Posts (Atom)