Posted by Chris M Sunday, December 20, 2009

Even more photographs

Stoney Indian Pass
Stoney Indian Pass in Glacier National Park. Various glacier landforms.

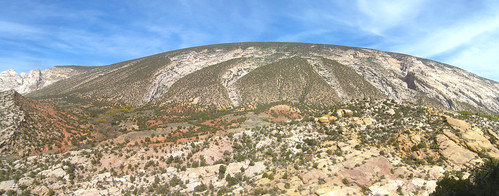
Split Mountain
Split Mountain, an anticline in Dinosaur NM. Take a look at the gigapan from Ron Schott for a different view and better geology write-up.

Labyrinth Canyon
Labyrinth Canyon of the Green River in Canyonlands NP.

Brontosaurs Tracks
Brontosaur tracks at Picket Wire Canyon in SE Colorado.

Valle Grande
Valle Grane, part of the larger Valles Caldera in N New Mexico.

Gila Box
Riparian forest, floodplain, terrace of Gila River in Gila Box in eastern Arizona.

Posted by Chris M Thursday, October 8, 2009

More photos from the field...

An addition to my previous post.

John Day Fossil Beds
John Day Fossil Beds in central Oregon

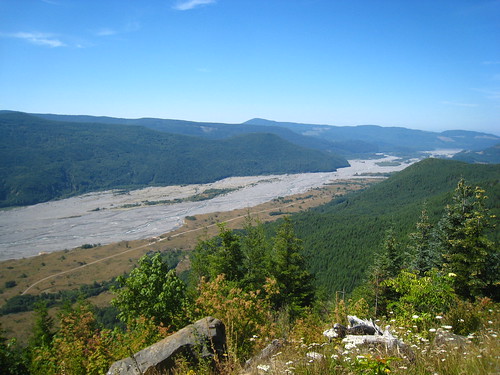
North Fork Toutle River
Volcanic deposits in North Fork Toutle River, near Mt St Helens.

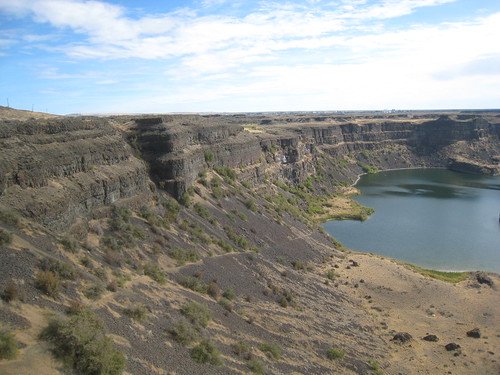
Dry Falls
Western section of Dry Falls, a waterfall formed during the Missoula Floods.


More photographs

Posted by Chris M Friday, August 28, 2009

I'm not dead yet

Really.

So rather than be an unemployed geoscience type this summer, I decided to be a an unemployed geoscience type that travels. So for the last two months, I have been backpacking in various places in the western US. Here are a few geology influenced pictures.

Jumble Lake

Cirques, tarns, moraines, and an active rockfall (notice dust cloud on mountain on the left) in John Muir Wilderness, Sierra Mountains.

Sag Pond

Sag Pond on San Andreas Fault at the south end of the Carrizo Plain.

Point Reyes

Point Reyes headlands.

Lava Tube

Lava tube at Lava Beds National Monument.

Posted by Chris M Saturday, June 13, 2009

Isostatic Rebound Hudson Bay


The subject of this month's Accretionary Wedge is "Let's do a time warp". Basically, what past (or future) geologic events would you like to be able to observe.

The geologic event I choose is the isostatic rebound of the Hudson Bay region. At the end of the Pleistocene and the beginning the Holocene, the massive ice sheets covering northern North America began to melt. As the weight of thousands of meters of ice over the Hudson Bay region was removed, the surface began to rise.

As the land continued to rise, new shorelines were repeatedly being formed, as the old shorelines were elevated higher. In some places, over 175 old shorelines ring the present bay level. This is equated to over 300 m over rebound in places. And it is still rising.

If I was in a space ship, watching this event unfold in a few minutes rather than thousands of year, I would see a huge mass of ice melting, followed by a quick jump of the land surface. As time would pass, the speed of the rise would slow down. On the surrounding land surface, almost bare rock surfaces, sweep clean of soil by the glaciers, would slowly become colonized by mosses and lichen. Soil would slowly begin to form, allowing shrubs and trees to gain a foot-hold. Water that would have originally laid on the nearly flat surface, would have started to cut the beginnings of stream channels.

I have reached the present. What does the future hold? The land will continue to rise, in some places still over 100 m. As the climate warms (at least in the relative future), more trees will move even more, as the rate of soil creation increases with the warmer temperatures. Lakes will fill in and drainages patterns will become less deranged.

Posted by Chris M Monday, April 20, 2009

Map Monday 13: Great Falls of the Columbia


I have been missing a few map Monday for no good reason, so maybe I can get in the grove again.

This week map is of "Great Falls of the Columbia" (aka Celilo Falls). The falls was on the Columbia River, just east of the Dallas on the border of Washington and Oregon. I use "was" because it was drowned by the construction of the Dalles Dam in 1957. The falls themselves are local knickpoints at a layer of basalt (part of the Columbia River Basalt Group).

The actual map is from the Lewis and Clark Expedition. Note the map shows their campsite and portage route around the falls.

The Map is from the David Rumsey collection.

Map Information
Allen, P., Biddle, N., Clark, W., Lewis, M. 1814. Great Falls of the Columbia. from History Of The Expedition Under The Command Of Captains Lewis And Clark, To The Sources Of The Missouri, Thence Across The Rocky Mountains And Down The River Columbia To The Pacific Ocean. Performed During The Years 1804-5-6.

Posted by Chris M Friday, April 10, 2009

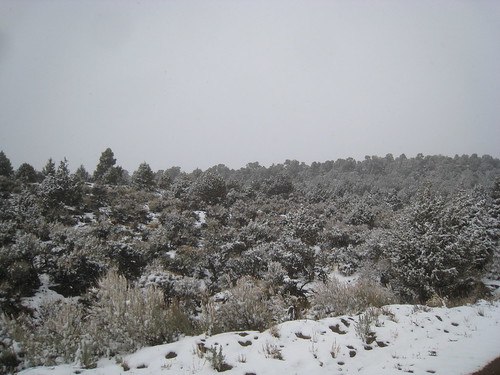
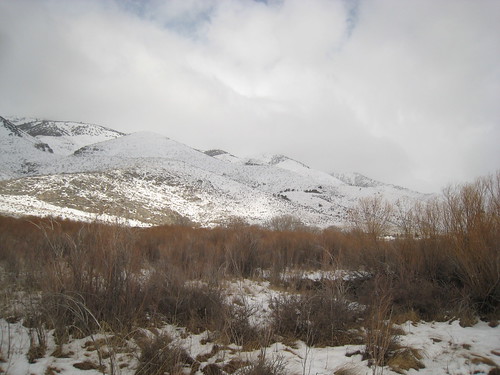
Not Spring

Big Bald Mountain

Hobson Pass

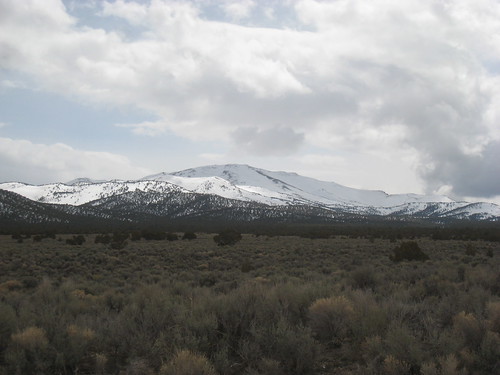
Ruby Mountains

Ruby Valley, NV

Posted by Chris M Friday, April 3, 2009

Linear-Lee Dunes on Mars


This month's IAG planetary geomorphology image is amazing.....

Posted by Chris M Thursday, April 2, 2009

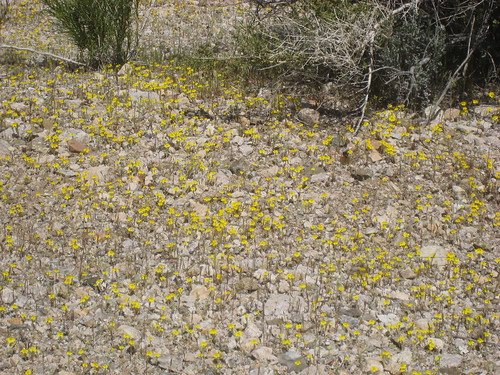
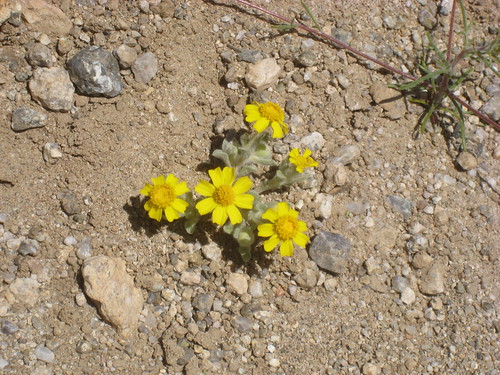
Spring

Flowers

Flowers

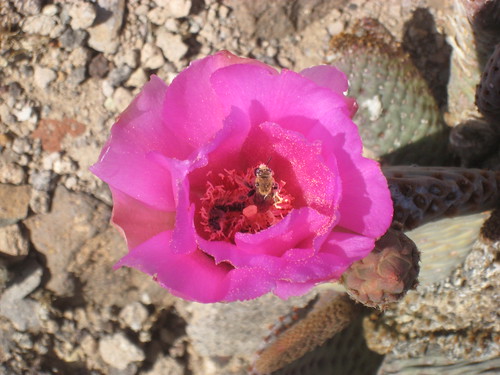
Flower & Bees

Posted by Chris M Thursday, March 26, 2009

Sichuan Province Landsides

If you haven't done it yet, I would advise everyone to take a gander at Dave's landslide blog and his amazing posts and photographs of some of the aftermath from the Chinese earthquake last year. Below is my favorite (the trucks near the bottom give you a sense of scale).

Photograph by David Petley

Posted by Chris M

In the field meme....

Well, there another meme in the geoblogesphere, what do you have with you in the field (see some other posts).

I bet mine is going to be a little different because I have so many tools, I can't take them all into the field at one time!

Clothes

Well, I guess it depends on the weather, but the constant is chest waders. Sure, you may be able to get away with hip waders, but I always manage to get water down my leg in them. Ok, the beard is constant too, but it isn't as integral.

Equipment
Now we get into the good stuff. First, lets do some discharge. How about a nice velocity meter? I use a flowtracker that automatically does the discharge calculation for your, depending on your method (.6, .2/.8, ice surface, etc).

Well, there are always wells. Will probably need an electronic well tape (beeps when the end of the tape hits water).

We can't forget about the actual chemical make up of the water. For "everyday" sampling I will be using a Hydrolab water quality sonde.

We have to communicate with all this equipment, so we need a computer that can handle some dirty and wet field sites. Looks like a job for a toughbook.

Last, but not least, a rite-in-the-rain notebook. I am playing around with water.

Posted by Chris M Monday, March 23, 2009

Map Monday 12: Geologic Map of Surtsey


With the news of a "new island" of formed by the Hunga Tonga-Hunga Ha’apai volcano in the south Pacific getting some attention in the geobloggosphere, I thought for this return to Map Monday, why not look back at another "recently created island". Surtsey is probably the most famous example of a undersea volcano reaching the surface. It has since become an important "natural experiment" of colonization of life.

The above image is a geologic map of Surtsey by the The Surtsey Research Society. The principle craters, vents, fissures are denoted by red lines. The purple colors shows various lavas, browns are tuff and tephra, and the tans are talus slopes and sand deposits.

Map Information
Jakobsson, S. P. 2000. Geological map of Surtsey (scale 1:5.000). Icelandic Institute of Natural History and The Surtsey Research Society.

Posted by Chris M Sunday, February 8, 2009

Map Monday 11: Sea Level Change 1993-2008

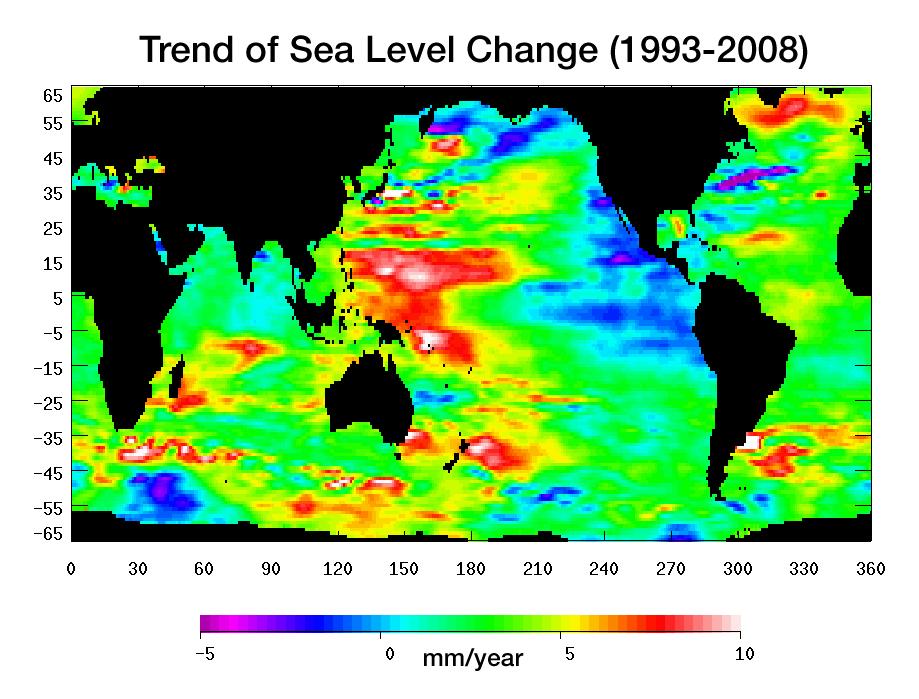
The week's Map Monday shows sea level changes 1993-2008. The data is based on two NASA/CNES satellites (Topex/Poseidon, Jason-1). White, red, and yellow areas show locations of increased sea level, while purple and blue show decreased sea level. The most obvious change is located in the western Pacific Ocean, reflecting the negative phase of the Pacific decadal oscillation (PDO). The PDO is similar to ENSO, except it can last for decades. It is also associated with weather events similar to ENSO, except not as extreme. During the negative phase of the PDO, the western Pacific is warmer, while the eastern Pacific cools (like La NiƱa).

Map Information
PIA11002: Portrait of a Warming Ocean and Rising Sea Levels: Trend of Sea Level Change 1993-2008. 2008. NASA/JPL.

Posted by Chris M Monday, February 2, 2009

Google Earth Historical Imagery

A couple week ago, BrianR at Clastic Detritus showed off the new higher-resolution bathymetry coverage in google earth. Well, version 5.0 was released today and it has some other fun stuff to play with. I like the historic imagery.

The pain about historic imagery is finding it and getting in a usable format on your computer. Even if you not going from a paper image, it still requires some work. Well google has gathered up some old imagery. Older than 20 years is pretty spotty, but there are some locations worth checking out.

The below images are of southern Lake Tahoe from 1940, 1969, 1987, 2004, and 2007. The resolutions are low, so I suggest opening the location up in google earth (38°56'14.56"N, 120° 0'38.81"W, 4.4 km altitude).

In 1940, notice the large marshland in the middle and the elongated delta of a stream in the NE.


Now in 1969, the marshland is a marina and the delta is reduced in size on the NW (sediment no longer allowed to replace erosion of delta?). Even the stream feeding the delta has been channelized.


In 1987, a spit has developed on the NE side of the stream's mouth.


It is 2004 and there is a new delta. Why is it forming now? Perhaps there is an increased sediment supply from the stream or dredging is no longer occurring?


Finally, we are at the newest image in 2007. The delta is gone again!

Posted by Chris M

Map Monday #10: Darwin's South America Cross Sections


With February being the bicentennial of Darwin's birth and the 150th anniversary of On the Origin of Species, how about a map by Darwin. The above map shows three cross sections of the southern Andes. Included are not only elevations but simple bedrock types (granite, sandstone, etc...).

Map Information
Darwin, C. R. 1846. Plate 1. From Geological observations on South America. Being the third part of the geology of the voyage of the Beagle, under the command of Capt. Fitzroy, R.N. during the years 1832 to 1836. Smith Elder and Co.

Map from The Complete Work of Charles Darwin Online

Posted by Chris M Monday, January 26, 2009

Map Monday #9: Central Idaho and Western Montana Wolf Packs

The Gray Wolf (Canis lupus) has been busy for the past few months. Last year, some populations of the wolf were removed from the endangered species list, however, they were put back on later by a judge. In the last days of the Bush administration, they were again delisted. However, since Obama took office, this was reversed again.

Although, wolves in the Yellowstone region get more attention, the largest population in the northern Rocky Mts is actually in central Idaho and western Montana. According to the latest public report, there are roughly 1,500 wolves in the northern Rocky Mts. Central Idaho/western Montana has 800 of these wolves, 450 are in the Yellowstone region, and 250 in northern Montana. The above map shows general locations of various wolf packs in central Idaho based on radio collar data. Maps are available for all three regions showing the wolf pack ranges.

Map Information
Central Idaho Wolf Recovery Area. 2008. From Rocky Mountain Wolf Recovery 2007 Interagency Annual Report.Prepared by Montana Fish, Wildlife, and Parks Information Services Division.

Posted by Chris M Monday, January 12, 2009

Map Monday #8: Streamgages in Antarctica

When you think of collecting some data in Antarctica, the cryosphere or maybe some seismology is probably what comes to mind. How about some stream discharge measurements?

The McMurdo Dry Valleys are famous for their lack of ice cover and the strong katabatic winds that blow. But during the summer, it gets warm enough to melt some ice and create streams in the dry valleys. And where there is water to measure, the USGS is there. They even have a couple sites that have real time data online! The below map shows the sites of 20 stream gage sites within Taylor valley.
USGS Stream Gage Taylor Valley

I just have to include the photograph of someone doing a discharge measurement! Maybe that can be me someday.... :-)
Streamgaging on Onyx River at Lake Vanda, Wright Valley, Antarctica
Streamgaging on Onyx River at Lake Vanda, Wright Valley, Antarctica. Photo by Chris Jaros, Institute of Arctic and Alpine Research.

Map Information
Locations of streamgages in the Taylor Valley, Antarctica. From Streamgaging in Antarctica. USGS Wyoming Water Science Center.

Posted by Chris M Monday, January 5, 2009

Map Monday #7: Iowa Isostatic Gravity Map


The further back into the earth's past you go, the less material exists and the harder it becomes to reconstruct the paleogeography. This makes understanding the creation of the cratons, the stable cores of continents, especially difficult. Although parts of the North American craton were cleaned of covering sediments by glaciation, some parts were further buried. However, techniques such as magnetic and gravity mapping allow us to glimpse what lies under covers of sediment and rock.

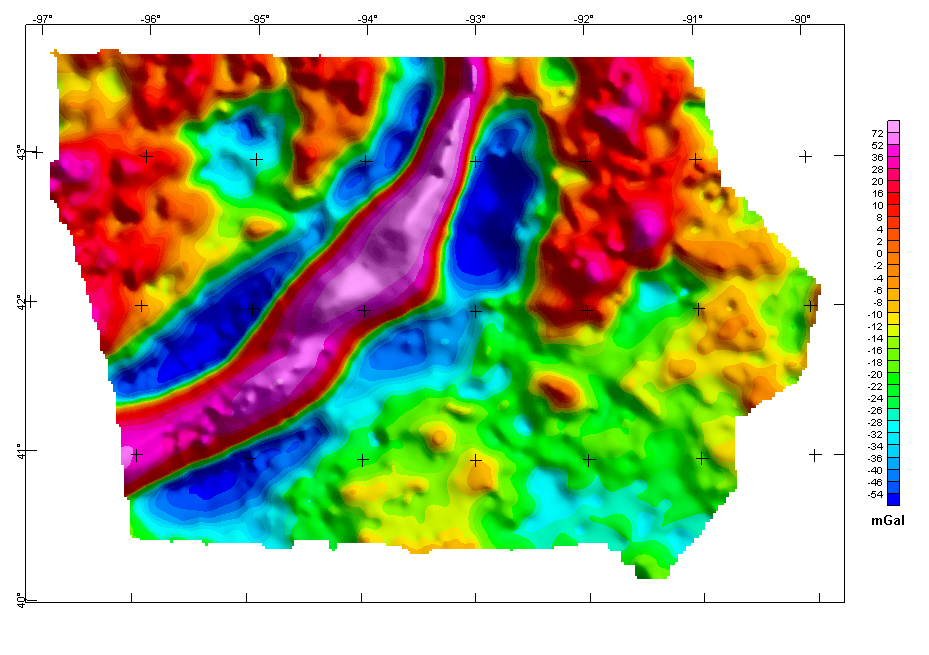
Above is a isostatic gravity map of Iowa. Locations of higher gravitational acceleration (recall g=mG/r2), are locations of denser rocks (oceanic rock), locations of lower gravitational acceleration are less dense rocks (continental). On the above map, red is higher acceleration and blue is lower acceleration.

The most obvious feature is the three "stripes" across central Iowa, consisting of a central high gravity stripe, and surrounding lower gravity stripe. The central high gravity stripe is the buried remains of the failed midcontinent rift. Roughly 1100 million years ago, the North American craton tried to rift, causing the stripe of heavy basalts, which were thrust up as the Iowa horst. The surrounding five basins were filled with lighter clastic sediments. The rift failed, but the gravity differences remain after 1100 million years.

Map Information
Iowa Isostatic Gravity Anomaly Map. From Iowa Magnetic and Gravity Maps and Data: A Web Site for Distribution of Data. Kucks, R. P. and Hill, P. L. USGS Data Series 135. 2005.

Posted by Chris M Thursday, January 1, 2009

Earth Impact Simulator

Although this has been around for a few years, I just learned about this neat earth impact simulator from the University of Arizona's Department of Planetary Sciences. You enter your distance from the impact and the earth material the projectile hits, along with the size, density, angle, and speed of the projectile. It returns some of the effects of such an impact.

I went with
Distance from Impact: 100.00 km = 62.10 miles
Projectile Diameter: 2000.00 m = 6560.00 ft = 1.24 miles
Projectile Density: 1000 kg/m3
Impact Velocity: 51.00 km/s = 31.67 miles/s
Impact Angle: 45 degrees
Target Density: 1000 kg/m3
Target Type: Liquid Water of depth 10.00 meters, over typical rock.

With such an impact, the results would be
Final Crater Diameter: 29.3 km = 18.2 miles
Visible fireball radius: 34.2 km = 21.2 miles
The fireball appears 77.7 times larger than the sun
Much of the body suffers third degree burns
The major seismic shaking will arrive at approximately 20 seconds.
Richter Scale Magnitude: 8.7
The ejecta will arrive approximately 144 seconds after the impact.
Average Ejecta Thickness: 1.36 m = 4.45 ft
The air blast will arrive at approximately 303 seconds.
Peak Overpressure: 844000 Pa = 8.44 bars = 120 psi
Max wind velocity: 693 m/s = 1550 mph

I am toast, literally!

There is even a paper describing how the simulator was created!
Collins, G. S., Melosh, H.J., Marcus, R. A. 2005. Earth Impact Effects Program: A Web-based computer program for calculating the regional environmental consequences of a meteoroid impact on Earth. Meteoritics & Planetary Science 40(6):817–840.